By Saqib Iqbal Ahmed
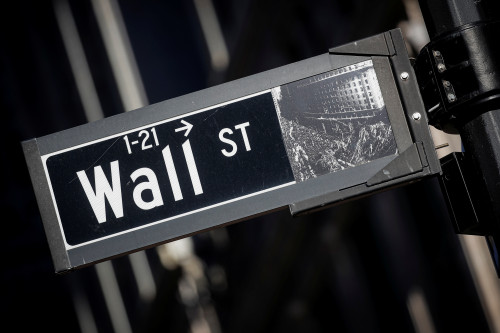
NEW YORK (Reuters) -As Wall Street draws the curtain on a tumultuous quarter in which stocks logged a record high before tumbling into correction, investors are faced with a mountain of policy uncertainty that clouds the outlook for coming quarters.
The S&P 500 Index finished the quarter down 4.6%, its worst first three months of a year since the first quarter of 2022.
Investors, who started the year with high hopes for pro-growth policies from the Trump administration, have been spooked by a barrage of tariff-related headlines.
Declining consumer confidence, coupled with concerns that President Donald Trump’s protectionist trade policies could spark inflation, have raised fears of a potential recession, or even stagflation.
Investors are assessing the damage to the stock market, including to the biggest winners of recent years, and are looking to history to gauge whether a turn in sentiment may be around the corner.
PEAK FEAR
Despite all the stock market weakness, the options-based measure of investor anxiety, the Cboe Volatility Index, has failed to crack 30 – a level associated with heightened fear.
Investors often look to this so-called fear gauge for a contrarian sign that bearish sentiment may have gotten overextended.
In the last 10 corrections of the S&P 500 that did not evolve into a bear market, the VIX rose above 30 in all but one instance, with an average peak level of 37.
With the VIX still hovering below the 30 mark, some analysts worry that the worst of the selloff might not have occurred.
“The bump in VIX, remember, it was near 17 just a couple of sessions ago, tells me that there is once again a relatively high demand from institutions for volatility protection,” said Steve Sosnick, chief strategist at Interactive Brokers.
“They’re still not panicking, so it’s not clear that we’ve seen true capitulation,” Sosnick said.
MAG SEVEN
The selloff has been particularly brutal for the “Magnificent Seven” stocks, which in quarters past boosted the benchmark index to record highs.
On average, shares of Apple, Microsoft, Alphabet, Amazon, Nvidia, Meta Platforms and Tesla have tumbled about 16% this quarter.
The stocks’ heavy weighting in the S&P 500 underperformance means the market cap-weighted index has underperformed the equal-weight S&P 500 – a proxy for the average stock in the index – by nearly 3.5 points, the third largest performance lag for the S&P 500 in the last 16 quarters.
Still, the sway held by the Magnificent Seven stocks over the broader market remains largely intact – their combined weight in the S&P 500 stands at 30.5%, down from 33.5% at the start of the quarter, according to LSEG data.
“Despite the recent turn in investor sentiment hitting the Magnificent Seven, earnings growth potential from key U.S. tech players remains strong and likely to continue contributing significantly to overall earnings growth over the coming years – suggesting a key driver of U.S. exceptionalism is likely down, but not out,” Seema Shah, chief global strategist at Principal Asset Management, said in a note.
WHAT NOW?
So far, the index has avoided closing below its March 13 low, which confirmed that the benchmark index was in a correction. But the last few sessions of the quarter have taken it uncomfortably close to that point, leaving investors uneasy about further declines.
“Investors might be pondering the likelihood of retesting the March 13 low, given that V-shaped market bottoms are rare,” Mark Hackett, chief market strategist at Nationwide, said in a note.
Investors can, however, take some solace from history.
Since 1928, the S&P 500 has, on average, risen 1.5% during the first quarter, with the second quarter clocking a much better average gain of 2.3%, a Reuters analysis of LSEG data showed.
Looking at quarters where the S&P 500 sold off sharply, on average, they were followed by better than average returns, the analysis of data since 2000 showed.
Since 2000, quarterly declines in excess of 5% are followed by an average gain of 2.2%, compared with an average gain of 1.5% for all quarters.
“At this juncture, the selloff appears more consistent with a 10% correction rather than a prolonged bear market,” Hackett said.
(Reporting by Saqib Iqbal Ahmed in New York; Editing by Matthew Lewis)


